Angle Measurements: Circle Graph
by Jamey
(USA)
Question
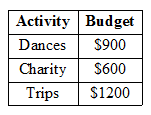
A class budget consists of $900 for dances, $1200 for trips, and $600 for charity. If the data were presented in a circle graph, what will be the angle measure of the part labeled "dances"?Answer
STEP 1: Let us first organize the given data into a table.
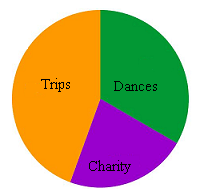
A circle graph is usually a circular chart which is divided into sectors illustrating percents. Since you are given three items, the circle will have three pie pieces.
STEP 2: To create the circle graph, the first step you will need to do is to make each of the numbers into a fraction out of the total. The total budget is 600 + 900 + 1200, or $2700.
The part representing "dances” will then be 900/2700 of 1/3.
Similarly, the parts representing “charity” and “trip” will be 2/9 and 4/9 respectively.
Here’s how the circle graph looks like:

STEP 3: Now, we know that a circle measures in total. If you
multiply the fraction representing a part of the circle by 360°, then you get the angle measure of that part.
You need to find the angle measure of the part labeled "dances". For this multiply 1/3 by 360°.

The angle measure of the part labeled "dances" is obtained as 120°.
Comments for Angle Measurements: Circle Graph
|
||
|
||
|
||


